Turning institutional data into a visual story.
The Carte Sanitaire is Luxembourg's definitive survey of its hospital sector. Art direction and editorial design of the synthesis report: hundreds of data points made legible at a glance.

The Observatoire National de la Santé is a department of the Ministry of Health and Social Security of the Grand Duchy of Luxembourg.
- Client
- ObSanté (Observatoire National de la Santé)
- Edition
- 2025 edition, updated every two years
- Role
- Art direction: branding & editorial design
- Deliverable
- Editorial system: synthesis + 5 publications
The Carte Sanitaire is the comprehensive survey of Luxembourg's hospital sector. Compiled and updated every two years by the Observatoire National de la Santé, it takes a full inventory of the Grand Duchy's care resources, facilities and activity.
The 2025 edition extends a collaboration begun in 2023 and adds a new strand: medical imaging. The synthesis remains the entry point to the whole set: it makes hundreds of figures legible for decision-makers, health professionals and the public.
The challenge
An official report framed by law demands rigour: figures, sources, precise hospital terminology. The risk? A dense, austere document nobody opens.
Our brief: to give that rigour an editorial identity that carries it with clarity and modernity: a coherent system, from the front cover to the last infographic, repeatable from one edition to the next and extensible to new topics.
A visual system, not a run of pages
- 01
Brand palette
A deep petrol green as the institutional signature, warmed by a lime accent that guides the eye and ranks the information.
- 02
Typography & grid
A geometric sans-serif, oversized section numbers and an airy grid that lets the key figures breathe and structures every spread.
- 03
A cover system
One photographic cover per publication, tied together by the “Edition 2025” lockup and the Observatoire logo, a visual family that's instantly recognisable.
The centrepiece: the synthesis cover
The heart of the project: a cover that distils the spirit of the 2025 edition. Clinical photography, the Observatoire logo and the lime accent as a through-line: an image that says institution, health and clarity all at once.
Making the numbers obvious
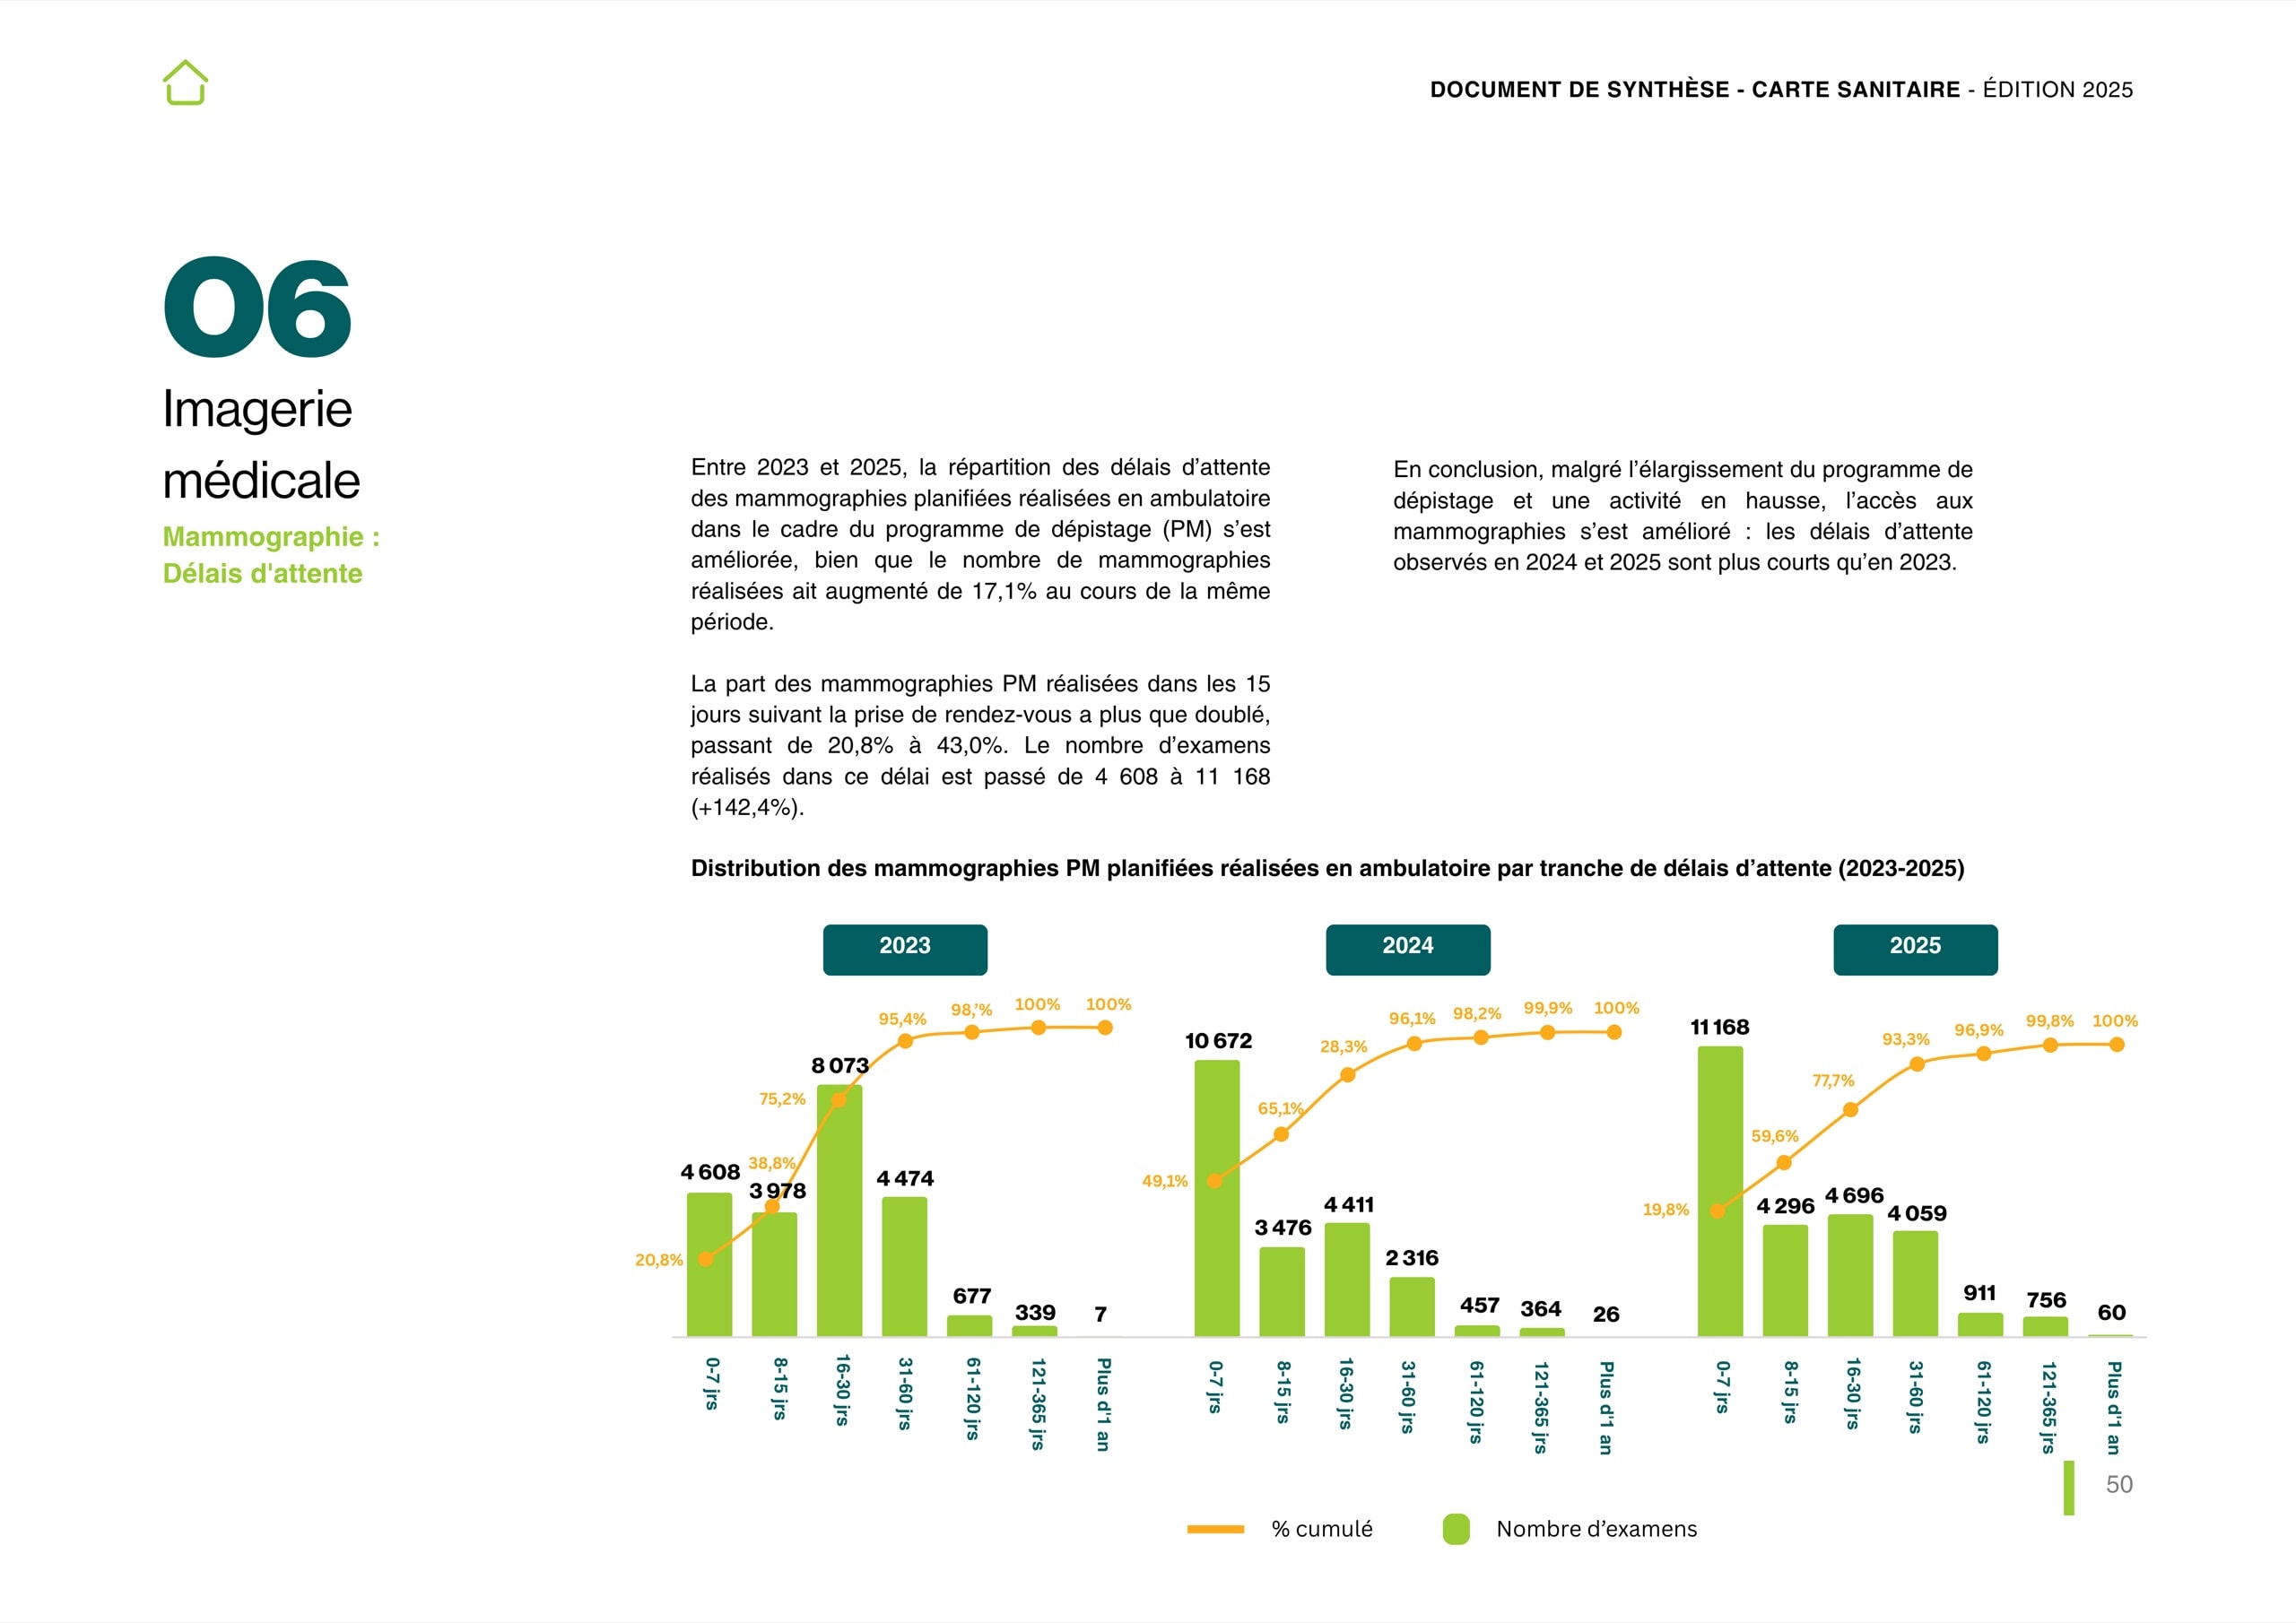
Every key statistic was reworked as an infographic: territory silhouettes, network diagrams, segmented histograms, canton-level choropleth maps. The data becomes legible at a glance while staying faithful to the official sources.
A brand-new strand: medical imaging
The 2025 edition introduces an entirely new topic: waiting times, MRI and CT scan volumes, paediatric imaging. A layout challenge: mapping fine-grained territorial data without ever losing the reader.
The answer: canton-level choropleth maps, in small multiples, that reveal at a glance the disparities in scan usage between 2023 and 2025.
The landscape, mapped in 2025
676,659
inhabitants in the Grand Duchy (2024)
13
hospital establishments recorded
2,686
beds installed, 96.6% of authorised beds
3.9
hospital beds per 1,000 inhabitants
From raw data to publication
- 01
Framing
Understand the report's structure, its audiences and the regulatory constraints.
- 02
Art direction
Evolve palette, typography and covers across the whole document family.
- 03
Editorial design
Lay out every spread and design each infographic.
- 04
Rollout
Adapt the identity into print and downloadable digital versions.